
2,910 people claimed unemployment benefits in West Suffolk in August, the most since February. Under-25 claims rose 22% in a year, double the Britain-wide rise.
2,910 people in West Suffolk were claiming unemployment-related benefits in August, the highest figure since February and 195 more than in August last year. Across Great Britain the same count rose 2.3 per cent over that year. In West Suffolk it rose 7.2 per cent, more than three times as fast (ONS claimant count via Nomis, dataset NM_162_1, released 15 September 2026).
The district rate is still low. 2.5 per cent of West Suffolk residents aged 16 to 64 are on the count, against 2.9 per cent across Suffolk, 3.3 per cent across the East of England and 3.9 per cent across Great Britain. The interesting part of this month’s release is not the headline. It is who the extra 195 people are, and which streets they live on.
More than half the rise is under-25s
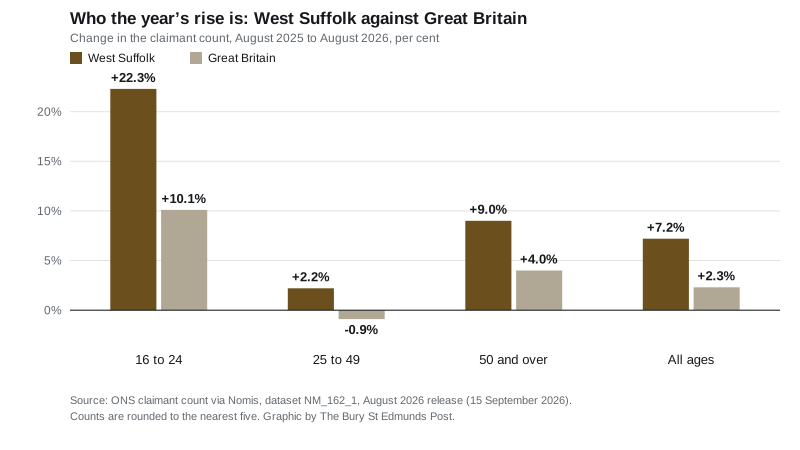
Split by age, the year looks like this:
- 16 to 24: 470 to 575, up 105, or 22.3 per cent. The Great Britain rise was 10.1 per cent.
- 25 to 49: 1,575 to 1,610, up 35, or 2.2 per cent. Across Great Britain this group fell 0.9 per cent.
- 50 and over: 670 to 730, up 60, or 9.0 per cent, against 4.0 per cent nationally.
Under-25s are 105 of the 195 extra claimants, so more than half of the district’s whole increase sits with people under 25. They now make up close to one claimant in five, against just over one in six a year ago.
Only one Suffolk district saw a steeper rise in under-25 claims: Mid Suffolk, at 22.7 per cent from a much smaller base of 220. West Suffolk’s 22.3 per cent is next, ahead of Ipswich (13.7 per cent), East Suffolk (11.6 per cent) and Babergh (4.1 per cent).
And almost all of it is men
The other split in the data is starker still. Male claimants went from 1,390 to 1,570, up 180. Female claimants went from 1,320 to 1,340, up 20. Men account for 180 of the 195 additional claimants, and the gap between the sexes in West Suffolk has gone from 70 to 230 in a year.
Ward by ward: 4.9 per cent in Haverhill, 1.0 per cent in Lakenheath
The district average hides a range of almost five to one. These are all 43 West Suffolk wards, ranked by the share of 16 to 64 year olds on the count in August 2026.
| Ward | Claimants | Rate |
|---|---|---|
| Haverhill Central | 105 | 4.9% |
| Haverhill South | 195 | 4.7% |
| Haverhill East | 115 | 4.3% |
| Newmarket East | 165 | 4.3% |
| Tollgate | 175 | 4.1% |
| St Olaves | 175 | 4.0% |
| Brandon Central | 70 | 3.5% |
| Minden | 95 | 3.1% |
| Eastgate | 45 | 3.0% |
| Mildenhall Great Heath | 60 | 3.0% |
| Brandon West | 55 | 2.9% |
| Newmarket North | 115 | 2.9% |
| Haverhill North | 95 | 2.8% |
| Haverhill West | 105 | 2.8% |
| Newmarket West | 105 | 2.8% |
| Abbeygate | 85 | 2.7% |
| Exning | 40 | 2.6% |
| Haverhill South East | 40 | 2.6% |
| Bardwell | 40 | 2.5% |
| Southgate | 50 | 2.3% |
| Barrow | 35 | 2.2% |
| Westgate | 60 | 2.2% |
| Clare, Hundon and Kedington | 110 | 2.1% |
| Iceni | 100 | 2.1% |
| Mildenhall Kingsway and Market | 45 | 2.1% |
| Rougham | 35 | 2.1% |
| Barningham | 30 | 2.0% |
| Stanton | 30 | 2.0% |
| Brandon East | 30 | 1.9% |
| Ixworth | 25 | 1.9% |
| Chedburgh and Chevington | 25 | 1.8% |
| Horringer | 25 | 1.7% |
| Risby | 30 | 1.7% |
| The Rows | 85 | 1.7% |
| Mildenhall Queensway | 25 | 1.6% |
| Moreton Hall | 85 | 1.6% |
| Withersfield | 20 | 1.6% |
| Manor | 30 | 1.5% |
| Kentford and Moulton | 25 | 1.3% |
| The Fornhams and Great Barton | 30 | 1.3% |
| Whepstead and Wickhambrook | 20 | 1.3% |
| Lakenheath | 65 | 1.0% |
| Pakenham and Troston | 20 | 1.0% |
(Nomis, claimant count by ward, August 2026)
Three of the six highest rates are Haverhill wards, one is Newmarket East, and two are in Bury St Edmunds. Haverhill, about 16 miles south of Bury St Edmunds, has six wards and 655 claimants between them, more than a fifth of the district total. Newmarket East alone has 165.
In Bury St Edmunds itself the eight town wards hold 770 claimants. The spread inside the town is wide:
- Tollgate 4.1 per cent (175 claimants) and St Olaves 4.0 per cent (175) are the highest, and between them account for 45 per cent of the town’s claimants.
- Minden 3.1 per cent (95), Eastgate 3.0 per cent (45), Abbeygate 2.7 per cent (85).
- Southgate 2.3 per cent (50), Westgate 2.2 per cent (60).
- Moreton Hall 1.6 per cent (85) is the lowest in the town, at well under half the Tollgate rate.
Of the 575 under-25 claimants in the district, 165 live in those eight Bury St Edmunds wards. Tollgate has 45 of them, the most of any ward in West Suffolk; St Olaves has 35 and Haverhill South 40.
Four things to know before quoting these numbers
It is not the unemployment rate. The ONS is explicit: the claimant count “does not attempt to measure unemployment, which is a concept defined by the International Labour Organisation (ILO) as all those who are out of work, actively seeking work and available to start work”. What it measures is “the number of people claiming benefits principally for the reason of being unemployed, based on administrative data from the benefits system” (ONS, Claimant Count QMI). Since Universal Credit it also picks up people who are working but on low earnings and still required to look for more.
Everything is rounded to the nearest five. The 43 wards add up to 2,915 against a district figure of 2,910. That is the rounding, not an error.
The ward figures have no year-ago comparison. West Suffolk’s ward series starts in January 2026. Against that January baseline the district is up 100, with the largest ward increases in Haverhill West and Iceni (both up 20) and Haverhill East (up 15), and the largest fall in Haverhill South (down 20).
Earlier months get revised. June 2026 was published as 2,900 when we reported it in August; it now stands at 2,875. July is 2,820. The August jump of 90 on July is far bigger than the same month’s move in any of the three previous years, which were minus 35, zero and plus 25.
What it means for you
If you are out of work or your hours have been cut, the claim itself goes through Universal Credit on GOV.UK, and West Suffolk Council explains how its own housing costs support fits alongside it on its Universal Credit page. The council also keeps a cost of living page listing the local help available, including its household support arrangements.
For anyone under 25, or advising someone who is, free careers advice and skills funding are available through the National Careers Service, which runs a telephone and webchat service as well as face-to-face appointments.
The next release covers September and is published on 20 October 2026. We will update these figures then, including the ward table.
Other local information: Bury St Edmunds house prices, council tax bands and bin collection days.
Have your say